Trade Intelligence
Competitive analysis from Datamyne US Maritime Import records. All data is disk-cached with 24-hour TTL and stale-on-error fallback.
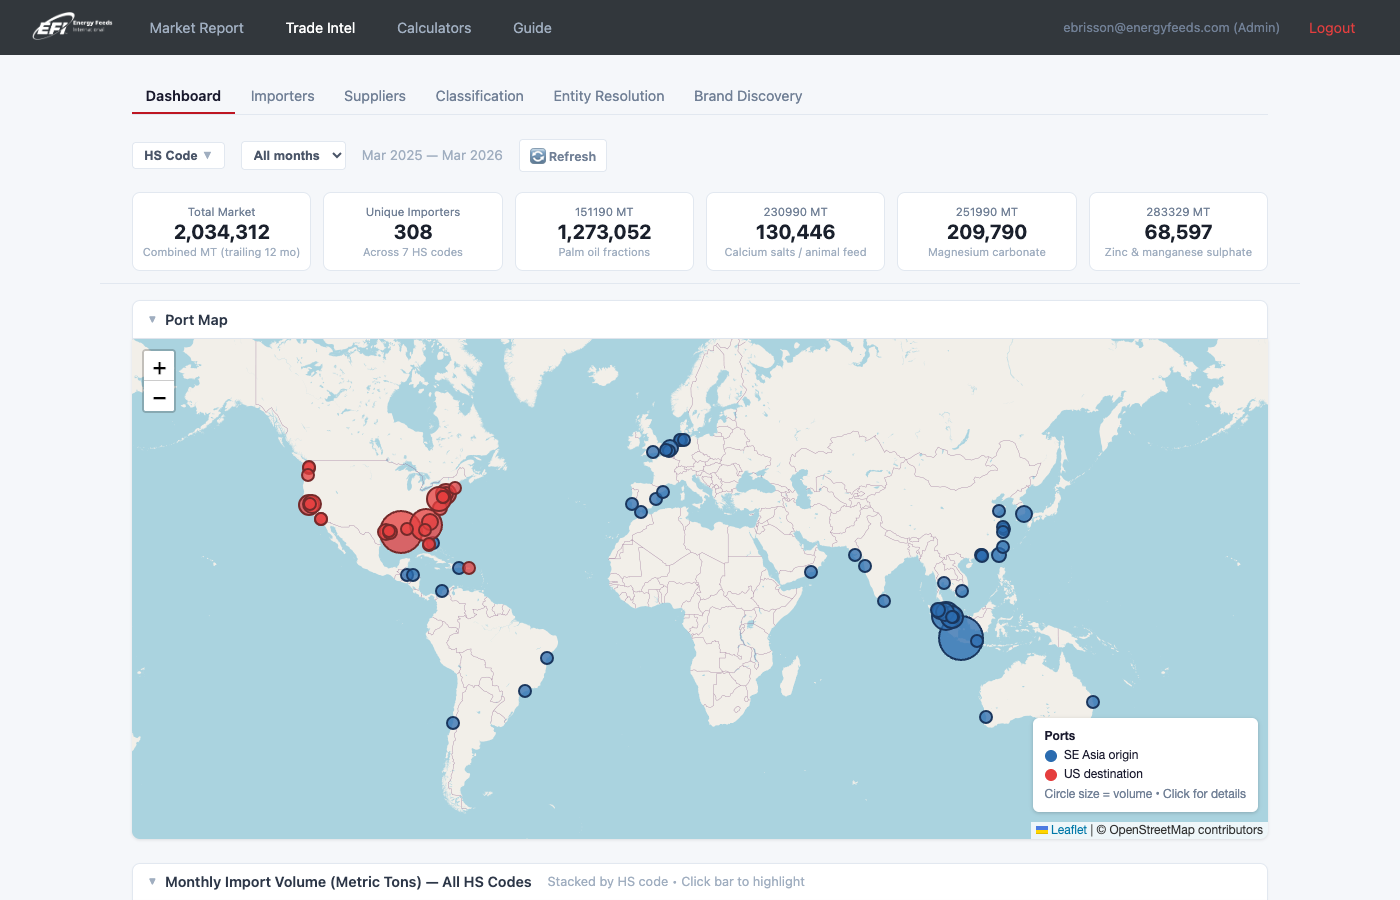
Dashboard
Overview with KPI cards, interactive port map (Leaflet), monthly volume chart (stacked by HS code), and flat importer/supplier ranking tables. Click a chart bar to highlight that HS×month — tables and map update via AJAX without page reload.
GET /trade-intel
Importer Rankings
Full importer table with state/name filters, column sorting, row-limit pills (10/25/50/All), and expandable AJAX detail cards showing supplier breakdown, proportion bar, and recent BOL shipments.
GET /trade-intel/importers
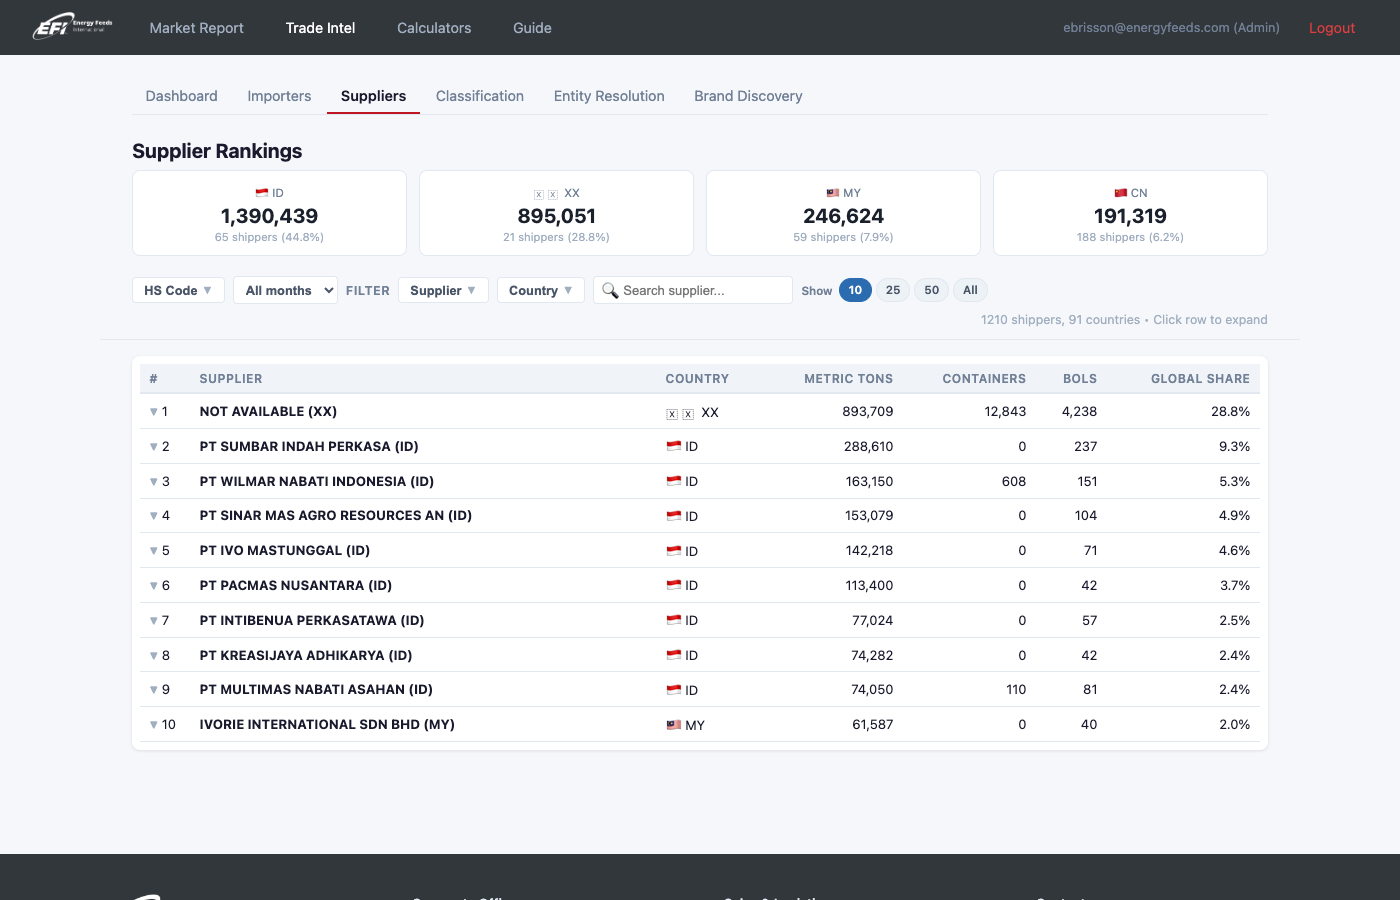
Supplier Rankings
Full supplier table with country/name filters. Expandable detail cards show importer breakdown with state filter badges and counterparty BOL shipments.
GET /trade-intel/suppliers
Classification Watch
HS code anomaly scanner. Keyword mismatch detection (product descriptions vs. HS code) and portfolio analysis (importers using unexpected codes). Flags potential misclassification.
GET /trade-intel/classification

AI Discovery Tools
AI-powered analysis that reveals hidden relationships and products in trade data.
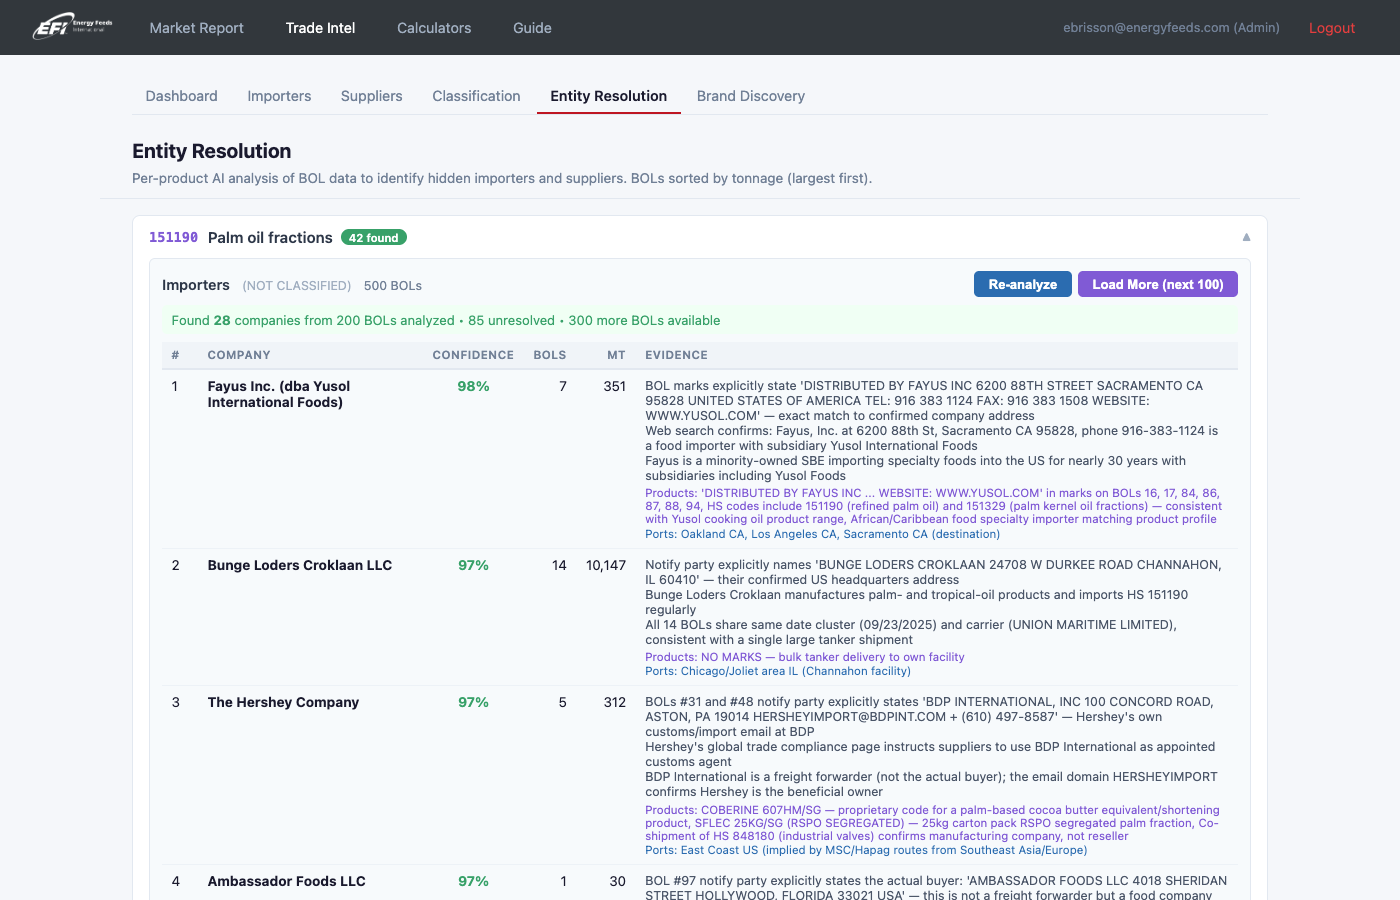
Entity Resolution
Identifies hidden importers and suppliers behind NOT CLASSIFIED and NOT AVAILABLE entries in Datamyne. Fetches BOL details (Notify Party, Master Consignee, marks/descriptions) and uses Claude to bulk-classify entities.
GET /trade-intel/entities
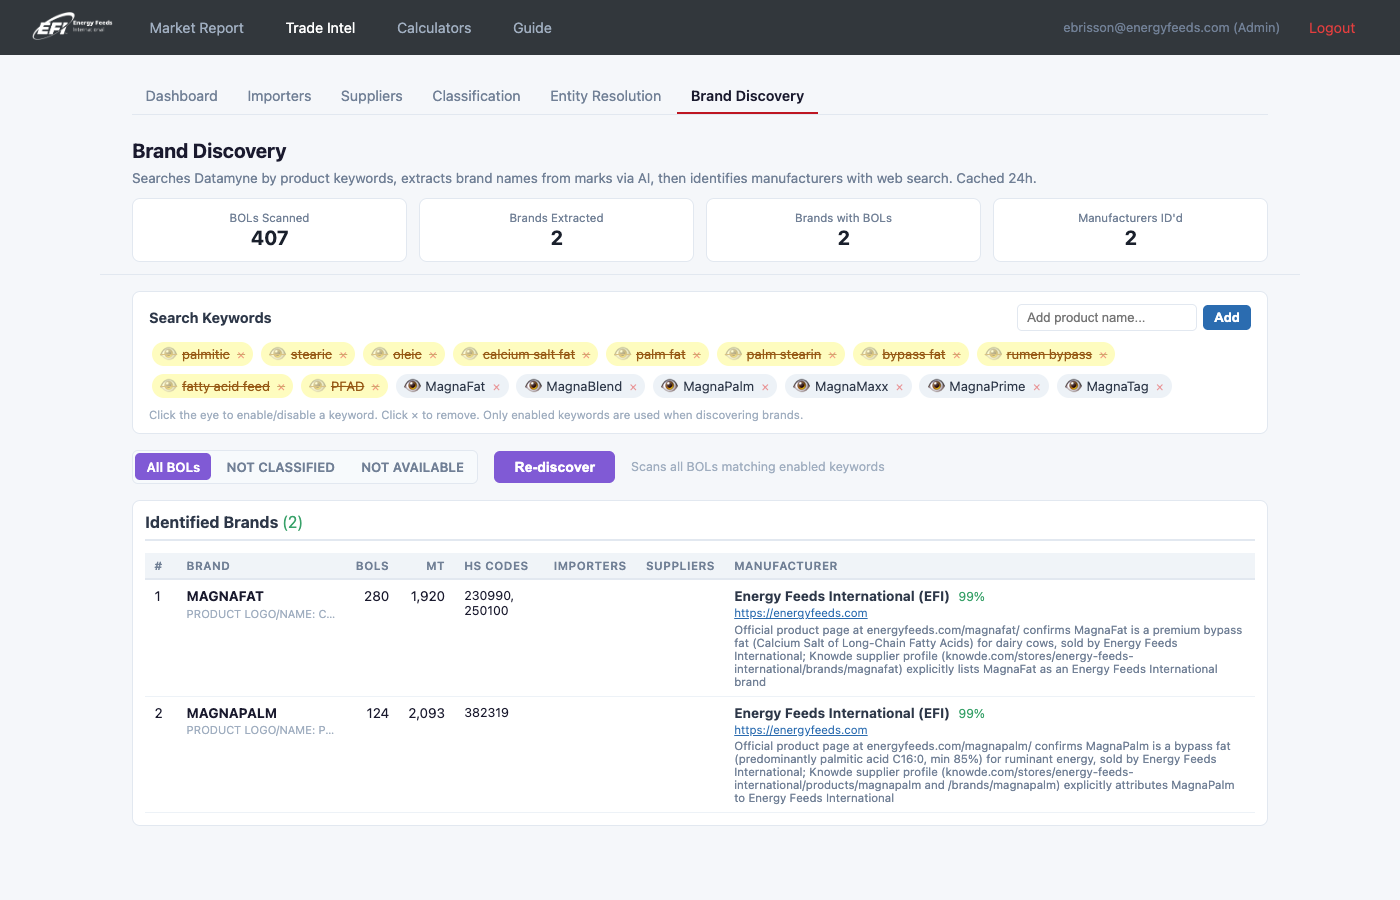
Brand Discovery
Automated product name identification from BOL marks and descriptions. Searches by commodity keywords (palmitic, stearic, oleic, etc.) across all HS codes, then uses Claude to extract brand names and web search to identify manufacturers.
GET /trade-intel/brands
Calculators
Interactive decision-support tools for pricing, blending, and ROI analysis.
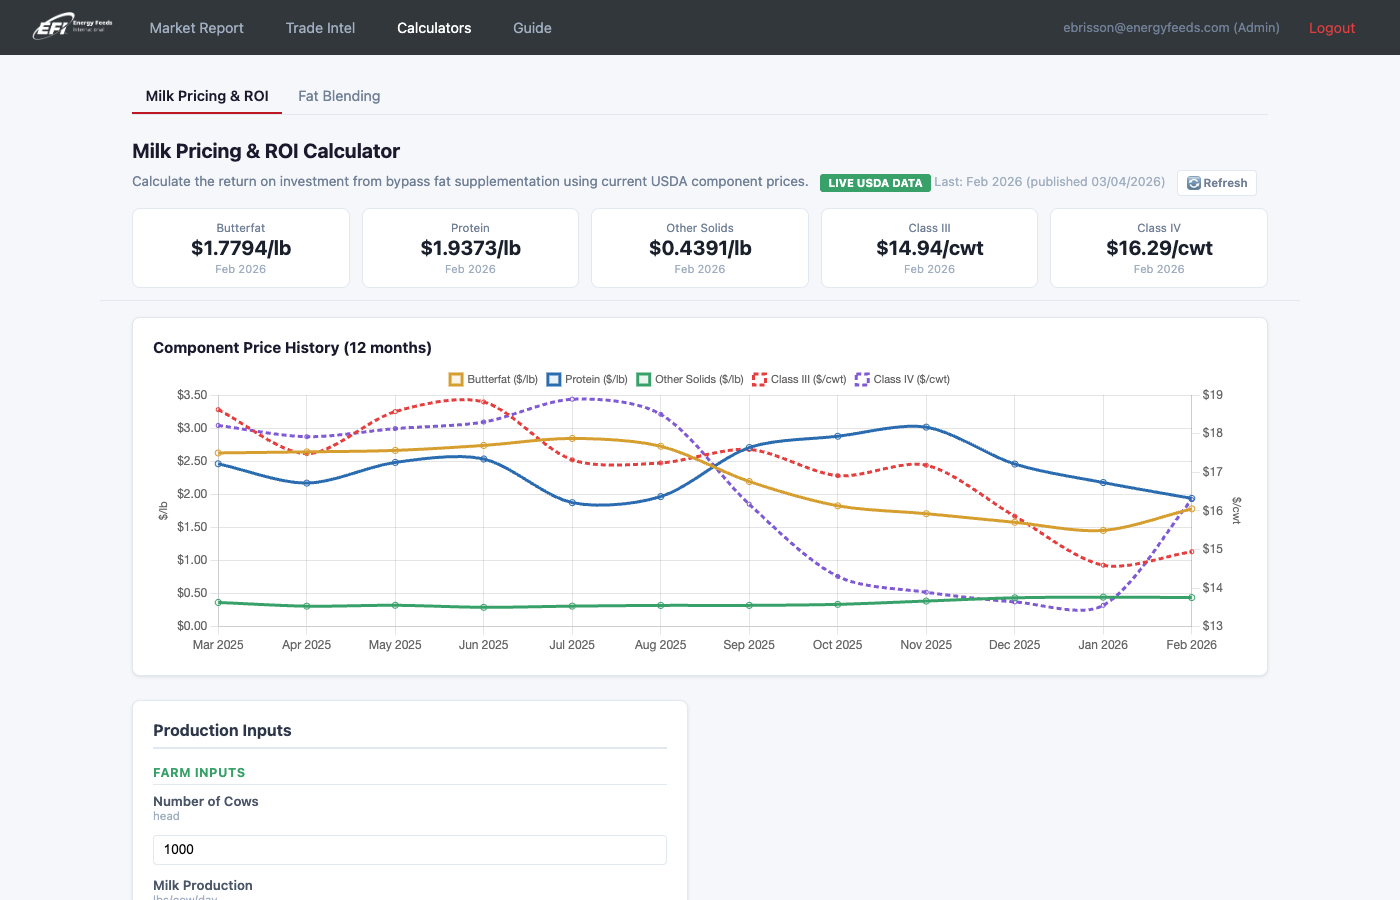
Milk Pricing & ROI
Interactive bypass fat ROI calculator with live USDA component prices (30-day cache, 12-month default range). Computes ROI based on butterfat, protein, and other solids pricing. Includes sensitivity charts and AI-generated dairy market narrative. EFI Product Sales overlay shows company sales volume (MT) or avg price below the USDA chart — click a month for per-product breakdown. Both charts are collapsible.
GET /trade-intel/milk
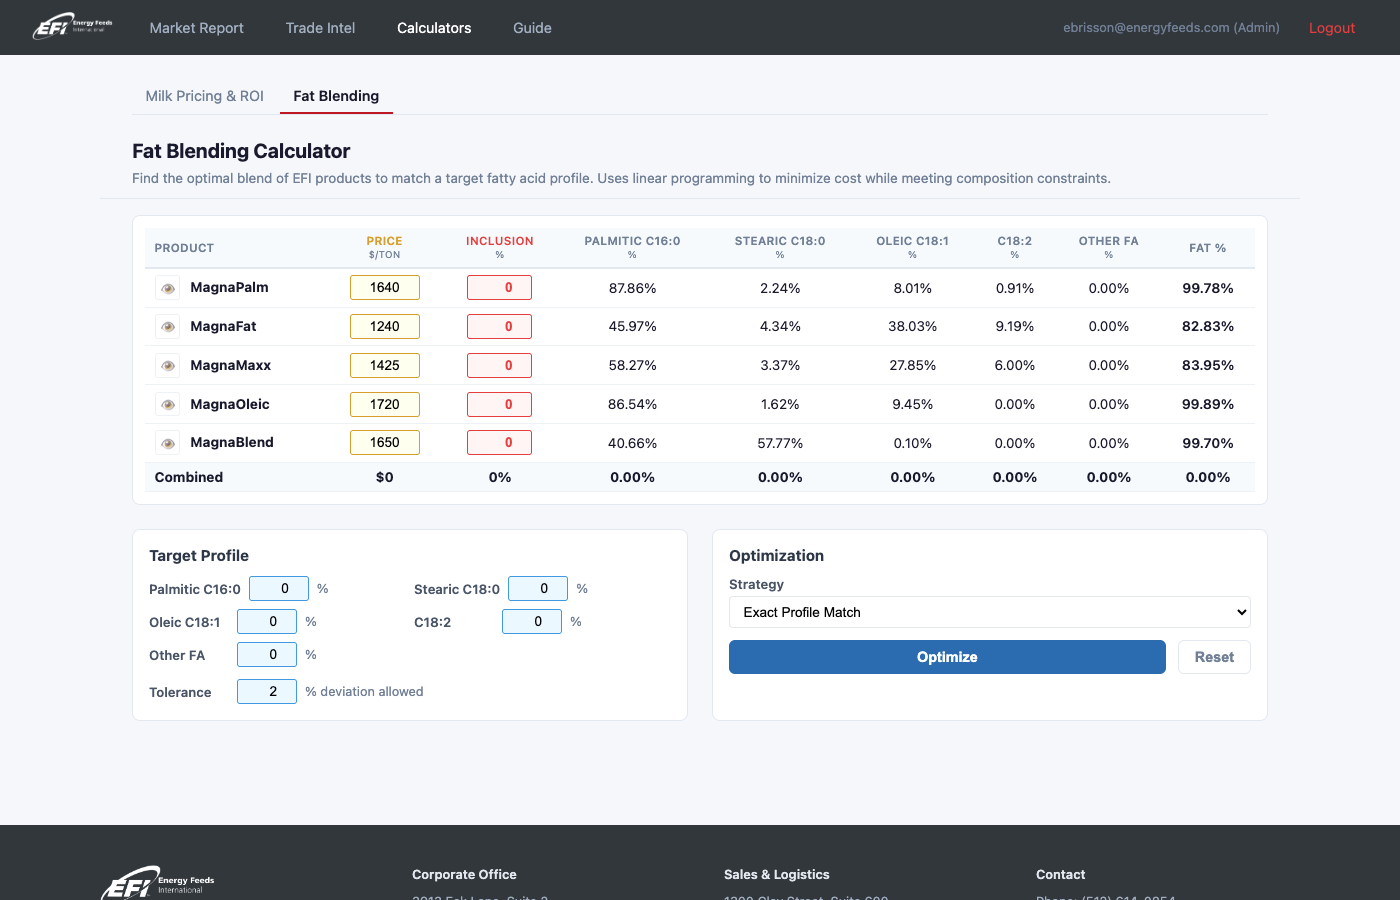
Fat Blending Calculator
LP optimizer for product blend ratios. Given target fatty acid profiles and available raw materials, finds the optimal blend (default: exact profile match). Toggle products on/off with eye button. Searchable target profile dropdown — select a competitor product from the Product Database to auto-fill target fatty acid values. Uses HiGHS solver via WASM.
GET /trade-intel/blending
Census FOB Pricing
FOB $/MT pricing by country and month from US Census Bureau trade statistics. Overlaid on the dashboard volume chart as a price trend line. Key benchmarks: Indonesia and Malaysia average FOB.
Integrated in dashboard KPI cards + chart
Product Database
Sortable table of 60+ competitive fatty acid products across 9 categories
(Palmitic Acid, Calcium Salt, Blended Fat, Specialty Fat, etc.).
Category dropdown, priority filter (high/mid/low), text search, and EFI-only toggle.
Full CRUD via modal form. Persistent storage in .data-cache/competitor-products.json,
seeded from built-in defaults.
GET /trade-intel/products
Data Collectors
8 specialized collectors query the Datamyne and USDA APIs, each with disk cache and stale-on-error fallback.
| Collector | Source | Cache TTL | Purpose |
|---|---|---|---|
| Competitor | Datamyne | 24h | Importer rankings by consignee code (totalsByConsignee) |
| Supplier | Datamyne | 24h | Shipper rankings by code (totalsByShipper) |
| Route | Datamyne | 24h | Trade routes, port summary, monthly volumes |
| Census | Datamyne Census | 24h | FOB pricing by country and month |
| BOL | Datamyne | 24h | Recent shipment details with counterparty + marks |
| Classification | Datamyne | 24h | HS code anomaly scanning (keyword mismatch + portfolio) |
| Entity Resolver | Datamyne + Claude | 24h | BOL fetch for hidden entities, AI bulk classification |
| USDA Dairy | USDA MPR DataMart | 30d | Component prices (butterfat, protein, Class III/IV) |
HS Codes Tracked
| HS Code | Description | Relevance |
|---|---|---|
| 382319 | Industrial fatty acids (palm) | Core EFI product category — palmitic acid, fatty acid distillates |
| 382311 | Stearic acid | Related fatty acid product |
| 230990 | Calcium salts / animal feed | MagnaFat, MagnaMaxx bypass fat products |
| 151190 | Palm oil fractions | Palm stearin, RBD palm oil derivatives |
| 283329 | Zinc & manganese sulphate | Feed mineral additives |
| 283640 | Potassium carbonate | Feed additive |
| 251990 | Magnesium carbonate | Feed mineral supplement |
Architecture
Embedded in Market Research server.
Market Intelligence runs on port 3000 alongside the Market Report.
Desktop top nav: Market Report | Trade Intel | Calculators | Guide.
Trade Intel and Calculators each show a single row of sub-tabs (no module switcher — top nav handles switching).
Calculators sub-tabs: Milk Pricing & ROI | Fat Blending | Product Database.
All routes are under /trade-intel/*. The Milk Pricing ROI calculator
can send its narrative and charts directly to the market report via
POST /api/send-roi-to-market.
Mobile PWA
Progressive Web App at /m/* routes. Bottom tab bar: Reports | Intel | Calc.
Intel sub-pages (Dashboard, Importers, Suppliers) via pill bar. Calc sub-pages (Milk & ROI, Fat Blending, Product Database) via pill bar.
Mobile Dashboard
KPIs, stacked volume chart (by HS code), collapsible port map. HS code multi-select and date filters optimized for touch.
GET /m/intel
Mobile Rankings
Importer and supplier rankings as card lists. Tap to expand via AJAX for supplier/importer breakdown and recent BOLs.
GET /m/intel/importers, /suppliers
Mobile Calculators
Milk Pricing & ROI with stacked inputs. Fat Blending with horizontal-scroll table and HiGHS solver.
GET /m/calc/milk, /blending
Dashboard UX
Interactive Chart Highlighter
Click a stacked bar to highlight that HS×month. Other bars dim to 15% opacity. Tables and map update via AJAX. HS code filter and month dropdown reflect the selection. Click again or "Clear highlight" to restore.
Port Map
Leaflet map with circle markers sized by volume. Blue = SE Asia origin, Red = US destination. Click for popup with tonnage, containers, and link to filtered rankings. Updates dynamically on chart highlight.
Expandable Detail Cards
Click any importer/supplier row to expand an AJAX-loaded detail card. Shows counterparty breakdown with proportion bar, recent BOL shipments, and sortable sub-tables. Accordion pattern (one open at a time).
Row-Limit Pills
10 | 25 | 50 | All pills on every table. Scoped text search per table. Column sorting with data-sort-val attributes. All work after AJAX table replacement.
Multi-HS Code Filter
Checkbox dropdown to select/deselect HS codes. "All" and "None" quick buttons. Red badge shows exclusion count. Navigates on change (full data reload).
Sticky Header
Subnav, filters, and KPI cards pin at the top while scrolling. Leaflet z-index managed to prevent map tiles overlapping the header.